XAU/USD: Elliott Wave Analysis and Forecast for 19.06.26–26.06.26


Major Takeaways
Main scenario: Consider long positions from corrections above 4,030.85 with a target of 4,900.00–5,610.00. A buy signal: the price holds above 4,030.85. Stop Loss: below 3,960.00, Take Profit: 4,900.00–5,610.00.
Alternative scenario: Breakout and consolidation below 4,030.85 will allow the asset to continue declining to the levels of 3,718.62–3,290.55. A sell signal: the level of 4,030.85 is broken to the downside. Stop Loss: above 4,100.00, Take Profit: 3,718.62–3,290.55.
Main Scenario
Consider long positions from corrections above 4,030.85 with a target of 4,900.00–5,610.00.
Alternative Scenario
Breakout and consolidation below 4,030.85 will allow the asset to continue declining to the levels of 3,718.62–3,290.55.
Analysis
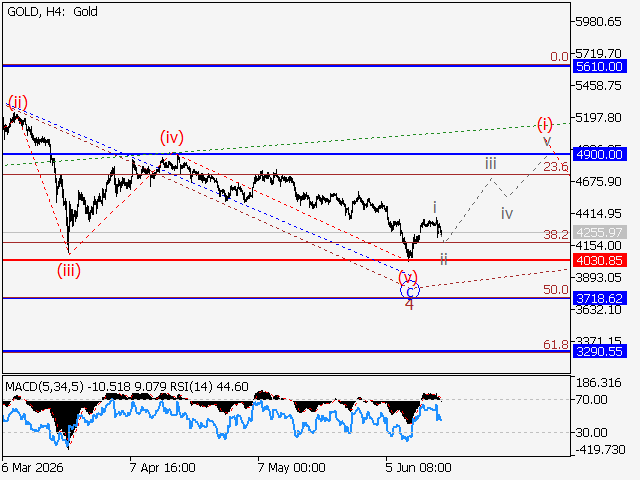
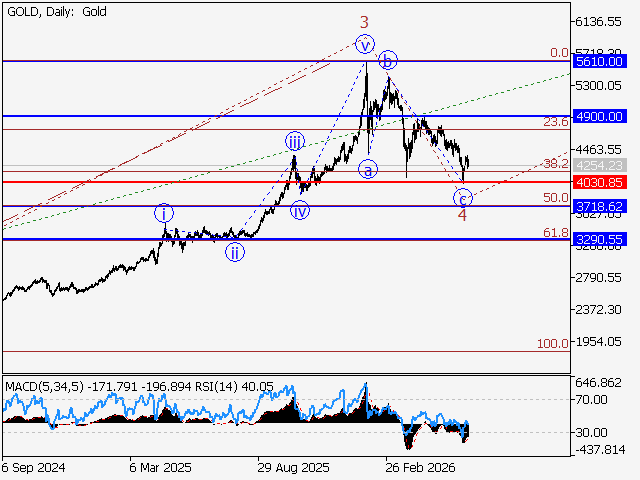
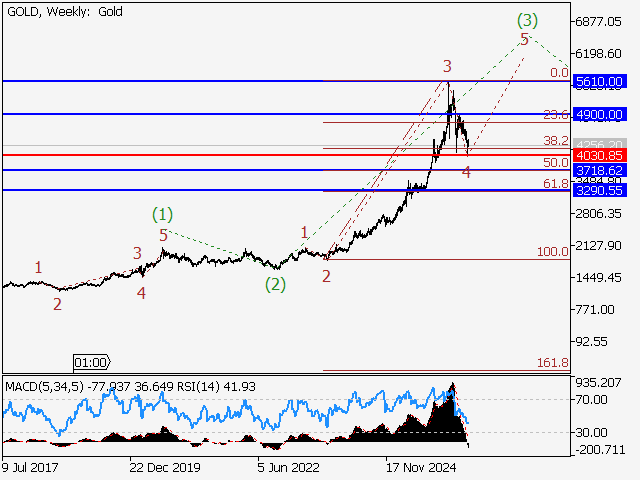
An ascending fifth wave of larger degree 5 is presumably developing on the weekly chart, with wave (3) of 5 forming as its part. The third wave of smaller degree 3 of (3) has formed on the daily chart, with bearish correction 4 of (3) also completed. The H4 time frame shows that the fifth wave 5 of (3) has started to develop, with counter-trend wave (i) of i of 5 unfolding. If the presumption is correct, XAU/USD will continue to rise to 4,900.00–5,610.00. The level of 4,030.85 is critical in this scenario as a breakout below it will enable the asset to continue declining to the levels of 3,718.62–3,290.55.
This forecast is based on the Elliott Wave theory. When developing trading strategies, it is essential to consider fundamental factors, as the market situation can change at any time.
Educational content only. Not investment advice.